Ingest GCP Logs from Elastic using GCS Input
In this post we’re going to use the GCS Filebeat input/module to copy log files from a GCP Storage Bucket to an Elastic instance Running on a Kubernetes cluster.
First, we are going to create a GCP storage bucket and using a GCP Log router, we will redirect the logs generated by our project to the bucket.
We’re going to use a local kubernetes cluster to deploy three components: an Elastic instance, A Kibana instance and A Beat (Filebeat) Instance. Additionally, an Elastic Ingestion pipeline is needed to pre-process the timestamp of the log entries.
Log entries are saved to Cloud Storage buckets in hourly batches. It might take from 2 to 3 hours before the first entries begin to appear. [1]
The ElasticSearch ingestion pipeline is needed because the Filebeat agent is using the timestamp of the ingestion instead of the log entry generation timestamp.
ECK Installation
We are going to deploy a local Kubernetes cluster with a ElasticSearch and a Kibana instance to filter, store and visualize the logs. We’ll use Filebeat to ship the logs to the Elastic server. Best way to install an ELK stack in our cluster is using ECK (Elastic Cloud on Kubernetes) Follow these guides:
- Install the ECK Operator
- create a [ElasticSearch instance](h ttps://www.elastic.co/docs/deploy-manage/deploy/cloud-on-k8s/elasticsearch-deployment-quickstart)
- create a Kibana Instance.
We’ll deploy Filebeat agent later.
Deploying the Google Logs router
TL;DR Source Code ( check the examples module)
We’ll use the google-export-logs terraform module to create the log router and the GCS bucket. This module will create several resources in our behalf: The log router itself, a Cloud logging service account, the needed permission to allow the service account to write logs into the bucket, And of course a Storage bucket.
We set a lifecycle rule to delete the files from the bucket after 30 days.
module "log_export" {
  source                 = "terraform-google-modules/log-export/google"
  version                = "~> 10.0"
  destination_uri        = "${module.destination.destination_uri}"
  filter                 = var.filter
  log_sink_name          = "${local.prefix}-logsink-gcs"
  parent_resource_id     = var.project_id
  parent_resource_type   = "project"
  unique_writer_identity = var.unique_writer_identity
}

// change to single region
module "destination" {
  source                   = "terraform-google-modules/log-export/google//modules/storage"
  version                  = "~> 10.0"
  project_id               = var.project_id
  storage_bucket_name      = "${local.prefix}-logsink-bucket"
  log_sink_writer_identity = "${module.log_export.writer_identity}"
  force_destroy            = var.force_destroy_bucket
  lifecycle_rules = [
    {
      action = {
        type = "Delete"
      }
      condition = {
        age        = 30
        with_state = "ANY"
      }
    }
  ]
}
We’ll also create a service account for the Filebeat agent, and the IAM project binding allowing it to use the objects within the Logs Bucket.
resource "google_service_account" "beat_service_account" {
  account_id   = "${local.prefix}-beat"
  display_name = "Service Account used by Filebeat to pull the Logs"
}


resource "google_storage_bucket_iam_member" "beat_service_account_binding" {
  bucket = module.destination.resource_name
  role = "roles/storage.objectUser"
  member =  "serviceAccount:${google_service_account.beat_service_account.email}"
}
We create an instance of the Terraform module and deploy it:
Note that the filter is by default set to
severity > "INFO"This filter was excluding a lot of logs in my recently created project, In this case we’ll use the filterseverity >= "INFO"to test and route more logs.
locals {
    project_id = "perfect-crawler-464423-g1"
}

module "logs" {
    source = "../"
    project_id = local.project_id
    filter = <<-EOT
        severity > "INFO"
    EOT
    force_destroy_bucket = true
}
#Apply the code
tofu init
tofu apply -auto-approveIf the apply is successful you’ll get the service account email created to allow the Filebeat instance to pull the logs and the name of the GCS bucket.
ElasticSearch Pipeline
Now, go to the ElasticSearch Ingest Pipelines page on the ElasticSearch UI Console and create this pipeline
[
  {
    "script": {
      "source": "ctx['actual_timestamp'] = ctx['gcs']['storage']['object']['json_data'][0]['timestamp']"
    }
  },
  {
    "date": {
      "field": "actual_timestamp",
      "formats": ["ISO8601"]
    }
  },
  {
    "remove": {
      "field": "actual_timestamp",
      "ignore_missing": true
    }
  }
]
Filebeat Agent
We need the name of the bucket and the service account JSON key to setup the filebeat agent. The bucket name is on the Tofu module outputs. The service Account JSON key can be created with gcloud. We don’t use Tofu because the key will be stored in plain text in our state.
gcloud iam service-accounts keys create key.json \
  --iam-account=SERVICE_ACCOUNT_EMAIL \
  --project=PROJECT_ID
We store the JSON key in a Kubernetes secret and delete it from our Filesystem to mount it in our Filebeat agent and to avoid any security issues by leaking it.
# Use the --namespace parameter if the case
kubectl create secret generic SECRET_NAME --from-file=key.json
Then, We deploy the Filebeat instance. replace:
- ELASTIC_SERVER_NAME: Reference to the kubernetes Elastic Object
- PROJECT_ID: GCP project ID
- GCS_BUCKET_NAME: the bucket name
- SECRET_NAME: the Kubernetes secret name
- ELASTIC_PIPELINE_NAME: Elastic Ingest pipeline name
## https://www.elastic.co/docs/deploy-manage/deploy/cloud-on-k8s/quickstart-beats
apiVersion: beat.k8s.elastic.co/v1beta1
kind: Beat
metadata:
  name: gcs-input
spec:
  type: filebeat
  version: 8.16.1
  elasticsearchRef:
    name: ELASTIC_SERVER_NAME
  config:
    filebeat.inputs:
      - type: gcs
        id: gcs-input
        enabled: true
        project_id: PROJECT_ID
        auth.credentials_file.path: /etc/sa/key.json
        retry:
          max_attempts: 3
          initial_backoff_duration: 10s
          max_backoff_duration: 60s
          backoff_multiplier: 2
        parse_json: true
        buckets:
          - name: GCS_BUCKET_NAME
            max_workers: 3
            poll: true
            poll_interval: 30s
            timestamp_epoch: 1630444800
        pipeline: ELASTIC_PIPELINE_NAME
    setup.ilm.enabled: false
    output.elasticsearch:
      indices:
        - index: "filebeat-gcs-%{[agent.version]}"
  daemonSet:
    podTemplate:
      spec:
        dnsPolicy: ClusterFirstWithHostNet
        hostNetwork: true
        securityContext:
          runAsUser: 0
        containers:
          - name: filebeat
            volumeMounts:
              - name: varlogcontainers
                mountPath: /var/log/containers
              - name: varlogpods
                mountPath: /var/log/pods
              - name: varlibdockercontainers
                mountPath: /var/lib/docker/containers
              - name: SECRET_NAME
                readOnly: true
                mountPath: "/etc/sa"
        volumes:
          - name: varlogcontainers
            hostPath:
              path: /var/log/containers
          - name: varlogpods
            hostPath:
              path: /var/log/pods
          - name: varlibdockercontainers
            hostPath:
              path: /var/lib/docker/containers
          - name: SECRET_NAME
            secret:
              secretName: SECRET_NAME
We check the status of the Beat:
$ kubectl get beat
NAME        HEALTH   AVAILABLE   EXPECTED   TYPE       VERSION   AGE
gcs-input   green    1           1          filebeat   8.16.1    30h
If we got files in out bucket already we should see data in the Elastic Index immediately. If we don’t have files in the bucket we have to wait the Cloud Logging hourly batch ~1 Hour
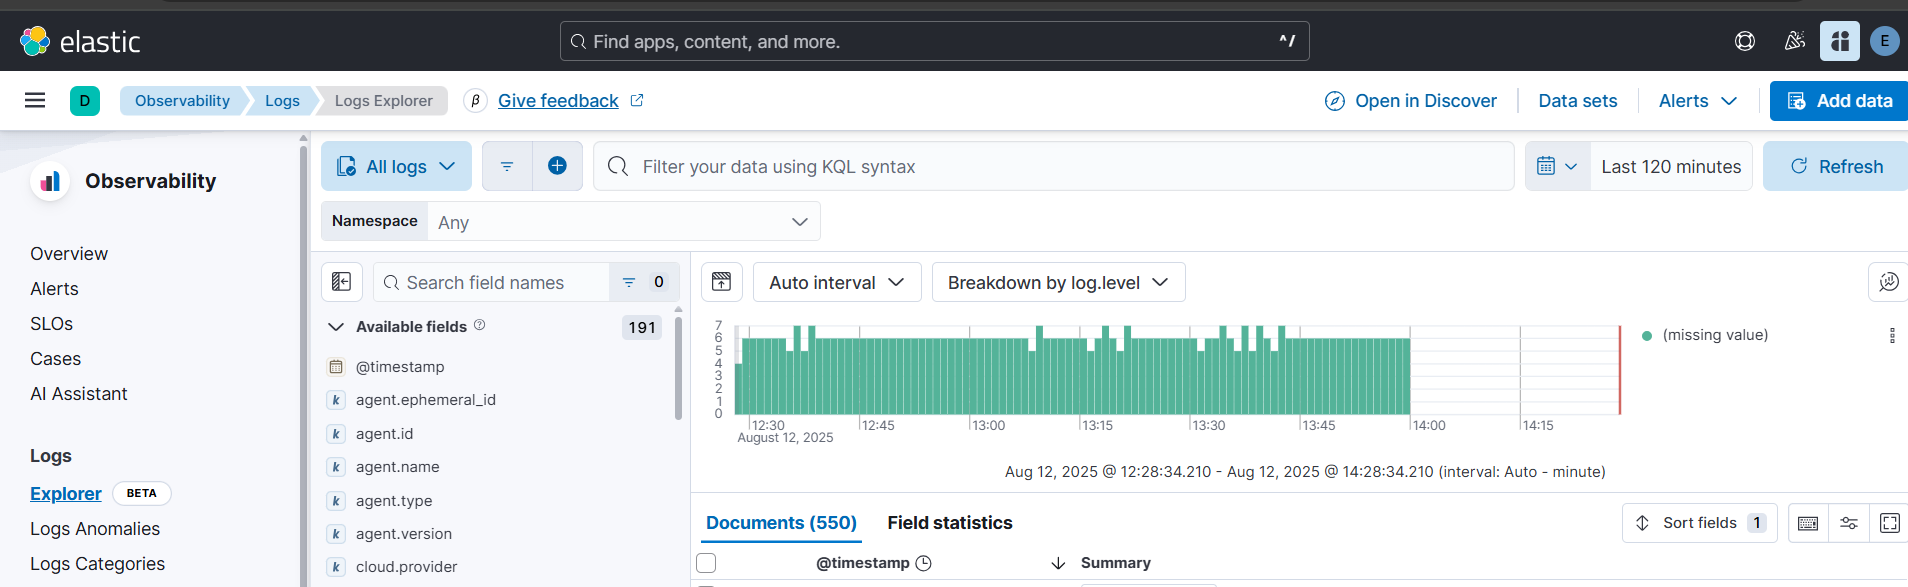
Go to the Kibana Console and query the logs (Observability > Logs > Logs Explorer ):
Eso es todo amigos!
Feel free to open an issue in the repo if something is broken!